
")
9.1. Buttons and Tools
9.1. Buttons and Tools
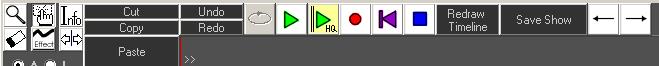 Fig.102: Timeline Editor: Buttons and Tools
9.1.1. Magnifying Glass
 The magnifying glass is used for zooming parts of the Timeline. The magnifying glass works in the same way as the one in the Figure Editor (See 6.3.8). The zooming can be done in several steps after each other.
Reset the zoom with a click on the tool with the left mouse button or by clicking the button “Redraw Timeline” with the right mouse button.
9.1.2. Hand
 The hand has similar functions as the one in the Figure Editor for marking or moving events (See 6.3.1).
Only events of ONE subtrack can be marked. The subtrack that is in the centre of the selection rectangle is activated.
Movements are done by click-dragging with the right mouse button. The marked events are moved. If no event is marked, the one under the curser is considered as marked. By holding the “Ctrl”-key during the intended movement, a copy of the original event is made and moved to the new position. It is possible to also move events to other subtracks as long as the new subtrack is of the same nature than the original one. Marked events have a differently colored background and can thus be identified.
9.1.3. Eraser Tool
 The eraser works like the one in the Figure Editor (See 6.3.5).
9.1.4. Effect Tool
 The Effect-Tool is used for creating effect events or for editing them. A click on the respective button activates the tool. With the tool opened, an area for inserting a new event can be selected, or one subtrack can be selected for editing with left mouse click (only works with effects subtracks, not with the figure track). The marked region is shown with a light yellow background. On releasing the mouse button, the effects window opens (Fig. 103).
Even though this tool works well, it is recommended to “live” record the effects.
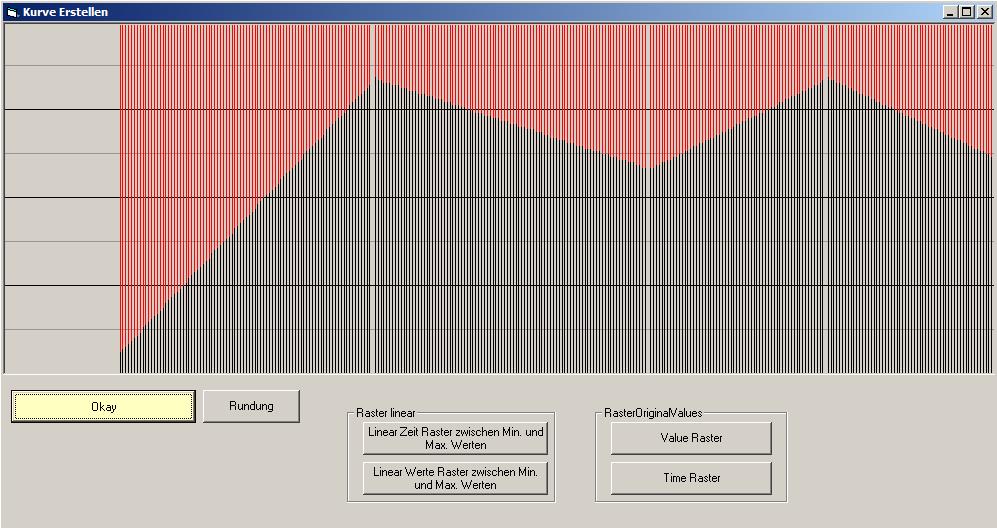
Fig.103: Timeline Editor: Window of the Effect Tool
9.1.4.1. Create/Edit Effects
With left or right mouse click and drag, events can be created in the window.
When using the right mouse button, the effects curve is aligned to the grid (horizontal lines, raster 1/8). Depending on the effect that is edited, the behaviour of the grid can also be different: The horizontal lines specify certain values of the effect. E.g. when using a rotation effect, the distance between the horizontal lines refers to a 45° rotation step. When using a displacement effect, the line distance corresponds with 25% of the maximum possible distance.
9.1.4.2. Smooth
With clicking the “Smooth” button, the effects curve is smoothened by an automatic calculation of average values between two steps. The more often the button is clicked, the more often the smoothening effect is applied. Remember that the start value of the selected area is also affected by the smoothening. Its new value may be the average of 0 and the actual value and may be too small.
9.1.4.3. Linear Time Raster between Min and Max Values
This curve modification identifies the highest and lowest effect values and generates a linear path with using constant time intervals. The time intervals can be adjusted with a right mouse click on the button.
9.1.4.4. Linear Value Raster between Min and Max Values
This curve modification identifies the highest and lowest values. Then the function generates a linear curve of interpolation points between these values, using fixed steps of the effects values. The time intervals are automatically determined based on the occurrence of a whole value step.
Smoother effect curves can be created this way, but it also leads to more effects events (which may negatively impact rendering performance in some rare cases).
9.1.4.5. Time Raster
This curve modification fills breaks in the effect path. It generates equal time intervals between the effects. This feature can be used for reducing the effect calls and thus improve performance. The time intervals can be set with a right mouse click on the button.
9.1.4.6. Value Raster
This curve modification fills breaks in the effect path. It identifies effect value changes and levels the effect curve based on this. Overall this leads to smoother effect curves at good performance.
9.1.4.7. Apply
Clicking on Apply closes the window and writes the edited effect curve to the previously specified / selected area on the very subtrack.
Click “Undo” if the applied settings shall be dropped and the previous settings shall be restored.
9.1.5. Info Button
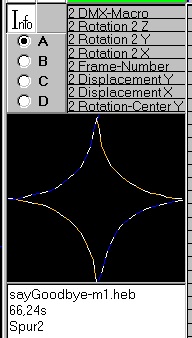
 This button opens a small area to show the active figure and its name (Fig. 104), when clicking on its position in the respective subtrack. In case of multi frame figures with the first frames being dark, it is useful to open the simulation window as well.
The info function can be used by click-dragging the mouse in the subtrack. When using the right mouse button for this, the events of ALL figure tracks, which are active at the very time, have their info displayed in the Info Area as well as output to the laser (if connected). The laser output is automatically activated and deactivated again afterwards. As very much information has to be handled, it is recommended to move the mouse slowly!
9.1.6. Buttons Cut, Copy and Paste
 These buttons are self-explaining (See 6.3.2).
9.1.7. Buttons Undo/Redo
 A click on UNDO cancels the most recent changes. The state after the last use of editing features or recording is restored. The undo keeps up to 10 levels back. REDO does the opposite of UNDO.
If the storing of the undo files takes too much time, which can happen when working with very complex and long shows, the storing of undo files can be switched off in “Options → Others”.
9.1.8. Show Control Buttons
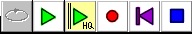
Fig.105: Timeline Editor: Show Control buttons
The Show Control Buttons handle the playing, recording stopping etc. of the laser show.
The green arrows are the Play buttons (Play and PlayHQ), the red, full circle is to start recording, the violet arrow (Jump to start) sets the timeline position to the start of the show and the blue square is used to stop the playing or recording. The start position for playing or recording can be specified with a click on the desired position on the tracks or on the timeline. If the playing or recording is stopped and restarted again, the restart begins at this position until another position is selected or the violet arrow is clicked. The start position is changed, when events are marked or deleted. Furthermore a loop timeframe can be specified.
9.1.8.1. Button Play
 This button is intended to be used during the editing of a show. A click on this button starts the replay of the show, but the quality can be poorer than with using the Play HQ button. Depending on the setup in the Timeline menu “Settings -> Start/Stop Laser output automatically” the laser output are switched on automatically.
The same is applies for the DMX-output. When using the normal Play button for playing a show not from the very beginning, some effects paths may not be applied correctly.
The advantage of the use of the Play button over the Play HQ button is that the Play button also allows for starting the playback at any time in the timeline, which makes it very suitable for show editing.
9.1.8.2. Button Play HQ
 The Play HQ button is used to start the playing of a show in high quality. “Start” means that after a click on the button and after a certain, adjustable time, the monitor is blacked out, the outputs to the windows are stopped and the show is displayed on the laser projector(s). The start delay can be adjusted with a right mouse click on the button. The show starts at its very beginning and all effects settings are set to the specified values. It is highly suggested to use the Play HQ button for real laser show displays.
The Playlist uses the Play HQ features as well.
9.1.8.3. Button Record
 A click on this button starts the recording of events to the selected subtrack. Depending on the setup in the Timeline menu “Settings -> Start/Stop Laser output automatically” the laser is switched on automatically. The same applies for the DMX-output. It is possible to repeatedly click on record. On each click the recording starts at the selected start position.
It is possible to record on several tracks at the same time. To select several subtracks at once (must be of the same kind), hold the “Ctrl”-key when selecting the subtracks with the mouse.
9.1.8.4. Button Jump to Start
 A click on this button stops the replay or recording and the timeline position is set to the very beginning of the show. Depending on the setup in the Timeline menu “Settings -> Start/Stop Laser output automatically” the laser is switched off automatically. The same applies for the DMX-output.
9.1.8.5. Button Stop
 A click on this button stops the replay or recording. Depending on the setup in the Timeline menu “Settings -> Start/Stop Laser output automatically” the laser is switched off automatically. The same is valid for the DMX-output.
9.1.8.6. Button Loop
 If a part of the Timeline is marked for play/record by click-drag with left mouse click, the loop button becomes activated. When clicking on the Loop button, the specified area of the timeline will be repeated infinitely.
9.1.9. Further Show Editor Elements
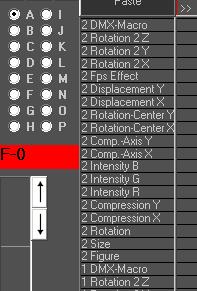
9.1.9.1. Track-Page Selection
“A”, “B”, ”C” … up to “P” …these are the available track pages. Each track page has 3 tracks with each having 19 subtracks for the figures and effects. The assignment of laser output hardware to these tracks can be done at Options -> Tab Hardware (See Chapter 8.2). To open another track page, just click on the respective radio button.
9.1.9.2. Figure and Effect Subtracks
Each figures subtrack has corresponding effect subtracks. The effect intensities set in these subtracks only apply to the figure assigned to the corresponding figure subtrack. Each subtrack is the “container” for the respective effect intensity or figure. To record events on a subtrack, the very subtrack must be activated with a click on its caption. A green background marks the active subtrack. If several subtracks shall be recorded at the same time (e.g. all three intensities for RGB), hold the “Ctrl”-key and click-select the desired subtracks.
According to the kind of the subtrack (figure or effect) the events are recorded with using the prior assigned keys (figures) or the mouse and the Effect Intensity Input.
The functions of the 19 subtracks are:
| Figure: | Start/Stop of figure-calls, recorded with assigned keys or by drag and drop |
| Size: | The size of the figure (Intensity input range: 0-120%) |
| Rotation: | The rotation of the figure (Intensity input range: +/- 180°) |
| Compression X: | The compression on the x-axis (Intensity input range: 0-100%) |
| Compression Y: | The compression on the y-axis (Intensity input range: 0-100%) |
| Intensity R: | Intensity red color (Intensity input range: 0-100%) |
| Intensity G: | Intensity green color (Intensity input range: 0-100%) |
| Intensity B: | Intensity blue color (Intensity input range: 0-100%) |
| Comp.-Axis x: | Compression along x-axis (Intensity input range: +/- 50%) |
| Comp.-Axis y: | Compression along y-axis (Intensity input range: +/- 50%) |
| Rotation Centre X: | Movement of rotation-centre along x-axis (Input intensity range: +/- 50%) |
| Rotation Centre Y: | Movement of rotation-centre along y-axis (Input intensity range: +/- 50%) |
| Displacement X: | Displacement along x-axis (Intensity input range: +/- 50%) |
| Displacement Y: | Displacement along y-axis (Intensity input range: +/- 50%) |
| Frame Number: | Selection of frames of multi-frame figures (Input-intensity-range: 0-100%) |
| Rotation 2X: | Rotation around x-axis (Intensity input range: +/- 180°) |
| Rotation 2Y: | Rotation around y-axis (Intensity input range: +/- 180°) |
| Rotation 2Z: | Rotation around z-axis (Intensity input range: +/- 180°) |
| DMX-Macro: | On/Off of DMX-Macros |

9.1.9.3. Effect Intensity Input
To record effects on the timeline, select the desired effects subtrack first. After hitting the record button it is possible to draw the effect intensity in the area on the very left of the Timeline Editor – see Fig. 107. It is possible to use the right mouse button to record the effect intensity as well: With this method, the effect levels are aligned to the horizontal grid.
9.1.9.4. Display of the Waveform
If the sound file is in the *.wav file format, the waveform of the sound file is displayed in the timeline bar. In case of wrong waveform recognition double click on the timeline bar to re-initialize the waveform display.